Presentation
Cache Manager allows you to reduce the load time for your pages, by preventing your server from having to recalculate pages that haven’t changed between two views, thus allowing them to be displayed faster the next time they are requested. You can cache both your pages and your modules in order to gain speed on your entire shop.
In this way you can make your shop easier for your clients to use and more optimised for your natural referencing.
General Points and Operating Principles
Caching is a procedure that allows pages that haven’t changed between a server and client to be stored in order to reduce the time it takes to display them the next time they are used.
The term “server” designates the machine that hosts the files that constitute your shop.
The term “client” designates any user that submits a query to the server, to display a page, for example.
The term “query” designates a client request sent to the server. e.g. clicking on the link for your shop sends a display query to your server for the page corresponding to the location.
Cache Manager is works when the server is generating the page before it is sent to the client for display.
It is, however, important to differentiate between the generation time and the display time:
– The generation time is the time the server needs to carry out the requested processes and generate the source code for the client’s query. (No style applied)
– The speed felt is the time it takes to generate the code and apply the style to the server code, such as CSS style files or JavaScript scripts.
Cache Manager is therefore involved in the generation time. It optimises the queries in order to send fewer queries and then stocks them for re-use during a subsequent query.
You thus reduce the page generation time since the queries are not generated but retrieved from a previous visit.
Installation
To install Cache Manager, see our tutorial on how to install a module here
Configuration
Global Configuration
Activate the Central Cache
![]()
This allows you to activate the central cache. The central cache is the cache that manages the basic pages for your PrestaShop shop, such as your product pages and cart pages, etc.
Activating this option gives you access to a new set of parameters that allow you to activate the cache for specific sets of pages.
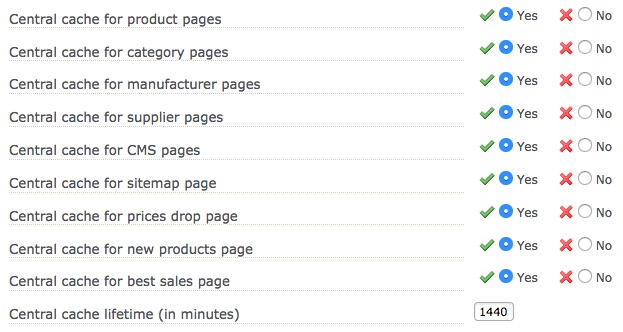
This allows you to restrict the cache to the product, category and sales pages, for example:
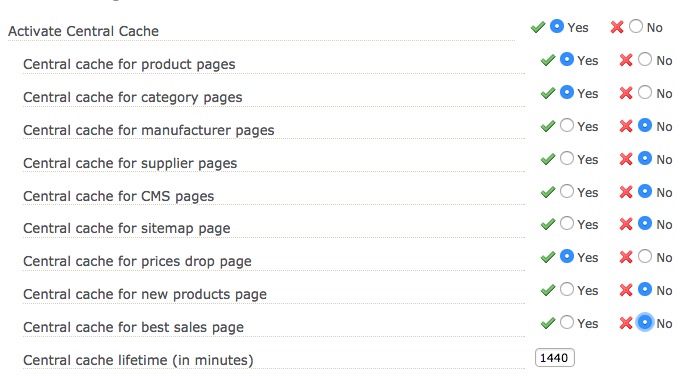
Finally, you can define the maximum cache storage duration. This is set to 1440 minutes, i.e. 24 hours, by default.
Activate the Module Cache

This allows you to activate the module cache. The module cache is the cache that manages the pages that your modules generate or alter.
This allows you to define the maximum lifespan of the module cache, before it is renewed.
Configure Module Cache
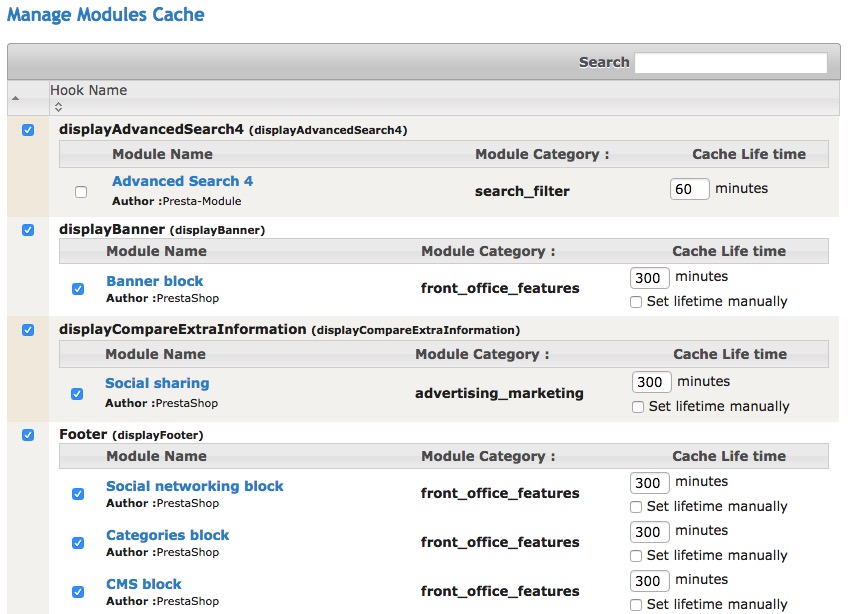
This allows you to choose the module(s) to which the module cache should be applied. You see a summary table of all the modules installed on your shop. These are categorised by hook.
A hook is an entry point on a page that allows a module to display content.
You may also state a cache lifetime for each of the modules, by ticking the Define cache lifetime checkbox and entering the time in minutes in the above field. The cache for a module is stored for 300 minutes by default.
Maintenance
This displays the Clear Cache button, which allows you to empty the cache currently stored on your server.
Scheduled Task
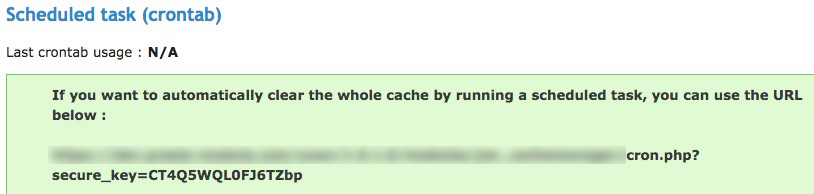
This provides you the link you should use when you introduce a scheduled task allowing the cache to be emptied (cron task).
Measuring the Impact Cache Manager has on Your Shop
As stated under General Points and Operating Principles, Cache Manager works on the time it takes to generate your page. It is hard to measure this time with tools such as GTmetrix, since they measure the speed felt by the user and not the generation time.
This last section will show you how to measure the impact of Cache Manager on your PrestaShop shop.
Choose the tutorial for the browser you use:
Tutorial for Google Chrome
We will use Chrome’s inspector to measure the generation time.
Go to the page for which you want to measure the generation time, then right-click on it and click Inspect.
The source code for your page then appears. Navigate to the Network tab.
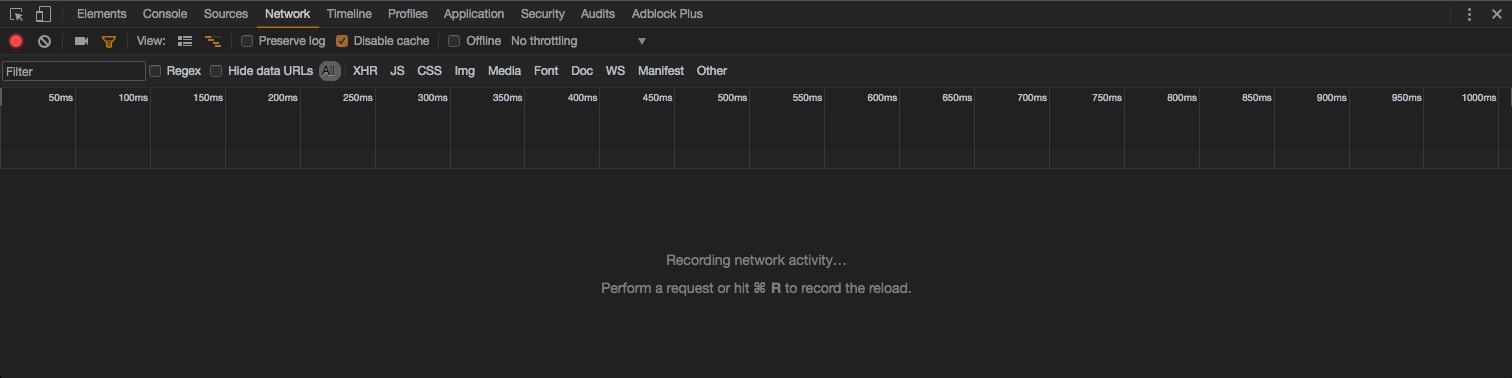
Then reload the page to get the inspector to measure the network activity.
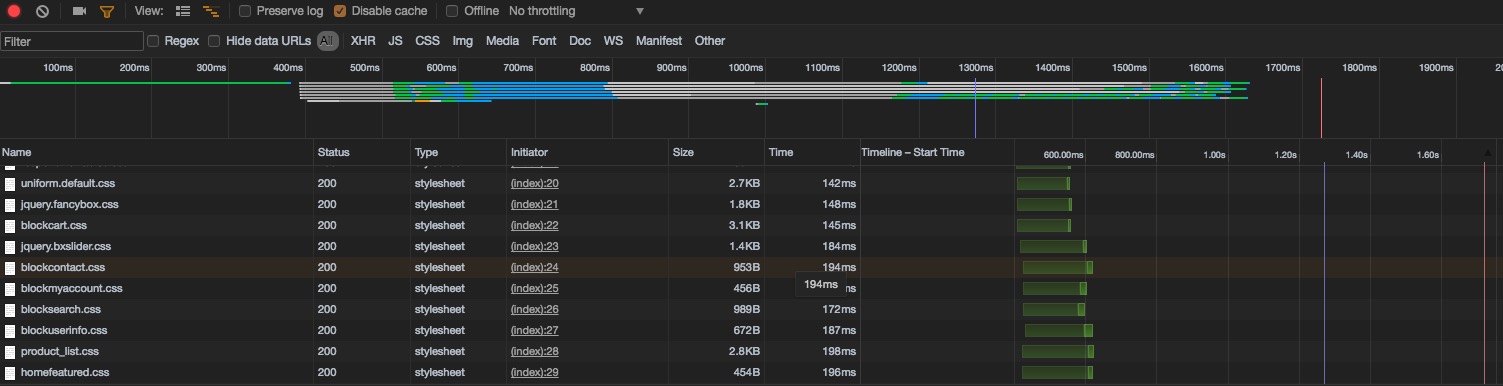
You should see a number of graphs with a long list under them as shown on the screenshot. Scroll up this list to the first entry, which is the TTFB, Time To First Byte, i.e. the time that elapsed before the first piece of data was received.
Click this entry to see the details. You can now see in-depth information on the exchange. Click Timing to show the statistics.
You now see the exchange time information. Don’t forget, we’re looking for the page generation time, which corresponds to the time that elapses before a server response is received after a query has been sent. The query here was an update, which is the same as asking the server to display the requested URL.
The information sought here is given under Waiting (TTFB).

The lower the Waiting (TTFB) value, the shorter the generation time for your page. The higher the value, the longer the generation time for your page.
To carry out this test again, just update the page and re-select the first entry in the list.
Carry out this test with the module activated (and activated for the page that you are testing), then empty the cache using the Maintenance tab, deactivate it and carry out the test again.
It is important to empty the cache before you deactivate the module or else the data already cached will be used when you load the page. This would then throw off the results of your test.
Tutorial for Mozilla Firefox
We will use the Firebug for Firefox extension to measure the generation time. Click here to download it if you don’t already have it.
Install it and then go to the page that you want to measure the generation time for, then right click it and select Inspect Element with Firebug.
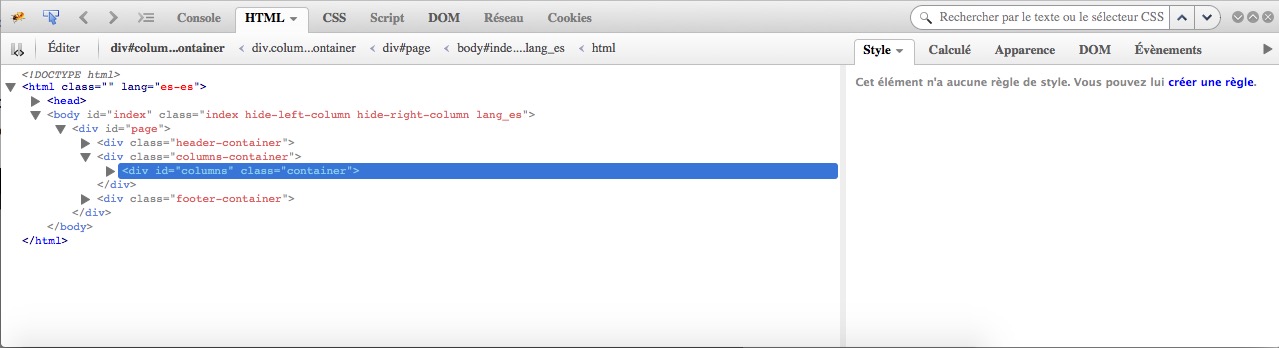
The source code for your page then appears. Click Network, then update your page to get the module to measure the network activity.
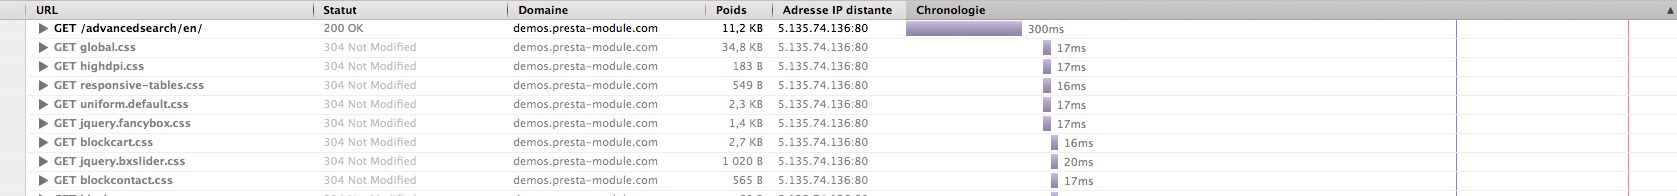
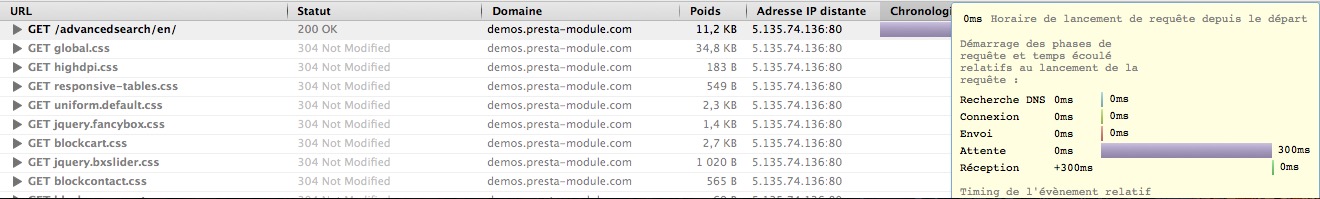
A long list of queries then appears. The first one corresponds to the waiting time between the query and the server response. The generation time is thus displayed in the Timeline column. Move your mouse over the graph in this column to see the details. This is the generation time information for the page.
To carry out this test again, just update the page and re-select the first entry in the list.
Carry out this test with the module activated (and activated for the page that you are testing), then empty the cache using the Maintenance tab, deactivate it and carry out the test again.
It is important to empty the cache before you deactivate the module or else the data already cached will be used when you load the page. This would then throw off the results of your test.